
Pool Service Growth Benchmarks: How Does Your Business Compare?



You know how many pools you service. You know what you charge. But do you know if those numbers are good? Do you know if your margins are healthy, your churn is normal, or your chemical costs are in line with other companies your size?
Most pool pros run their business by feel. They know when things are "going well" and when they are not. But without real benchmarks, you have no way to tell where you stand or what the next level looks like. This guide gives you the numbers. We break down what a typical pool service company looks like at four different sizes, so you can see exactly where you are and what it takes to get to the next tier.
Key Takeaways
- Know your tier. Solo operators, small companies, mid-size companies, and large companies all have different benchmarks for revenue, margins, and costs.
- Revenue per pool matters more than pool count. A company with 50 pools at $185/month makes more profit than one with 80 pools at $120/month.
- The 80-100 pool wall is real. Most solo operators hit a ceiling here. Breaking through requires hiring, which changes everything.
- Churn under 10% per year is the goal. Every lost customer costs you $500-$1,500 to replace.
- Track your numbers monthly. PoolDial's analytics dashboard shows you all these metrics in real time, so you never have to guess.
PoolDial Benchmarks for Solo Operators (30-60 Pools)
This is where most pool service companies start. One truck, one person, maybe a part-time helper in the summer. You do everything yourself: the cleaning, the billing, the phone calls, the repairs. Your biggest asset is your time, and your biggest limit is that you only have so much of it.
Here is what a healthy solo operation looks like:
| Metric | Low End | Healthy | Top Performer |
|---|---|---|---|
| Pool count | 30 | 45 | 60 |
| Monthly revenue | $4,500 | $7,650 | $11,100 |
| Annual revenue | $54,000 | $91,800 | $133,200 |
| Avg revenue per pool/month | $150 | $170 | $185 |
| Technicians | 1 (owner) | 1 (owner) | 1 (owner) |
| Annual churn rate | 15% | 10% | 6% |
| Net profit margin | 35% | 45% | 55% |
| Chemical cost per pool/month | $22 | $18 | $15 |
| Drive time per day | 2.5 hours | 1.5 hours | 1 hour |
At this stage, profit margin is high because you are not paying anyone else. Your biggest cost is chemicals, gas, and your truck payment. A solo operator with 45 pools charging $170/month and keeping margins around 45% is taking home around $41,000 a year before taxes. That is solid for a one-person operation, but it is also a sign that growth requires more than just adding more pools to your schedule.
Notice the drive time column. Top performers at this tier spend about 1 hour per day driving between pools. That is because they have built tight route density. The low-end operator driving 2.5 hours a day is burning time and gas that could be spent on 2 to 3 more pools.
PoolDial Benchmarks for Small Companies (60-150 Pools)
This is the tier where things get interesting and also where most pool companies get stuck. You have outgrown what one person can handle, but you are not yet big enough to have real systems in place. You might have 1 to 2 employees. You are probably still doing routes yourself while also trying to manage the business side.
| Metric | Low End | Healthy | Top Performer |
|---|---|---|---|
| Pool count | 60 | 100 | 150 |
| Monthly revenue | $9,600 | $17,000 | $27,750 |
| Annual revenue | $115,200 | $204,000 | $333,000 |
| Avg revenue per pool/month | $160 | $170 | $185 |
| Technicians | 1 (owner + part-timer) | 2 (owner + 1 tech) | 2-3 (owner + 1-2 techs) |
| Annual churn rate | 12% | 8% | 5% |
| Net profit margin | 20% | 30% | 38% |
| Chemical cost per pool/month | $20 | $16 | $13 |
| Drive time per day (per tech) | 2 hours | 1.5 hours | 1 hour |
The big shift at this tier is that your margins drop. You are now paying someone else, which means labor becomes your biggest expense. A tech making $18-$22/hour plus vehicle costs will eat 25-35% of the revenue from the pools they service. That is normal. The trade-off is that you get your time back to sell, manage, and grow.
Chemical costs also tend to drop at this tier. Why? Because you are buying in larger quantities. A solo operator buying chlorine 2 buckets at a time pays more per gallon than a company buying a pallet. If you are still buying chemicals at retail prices at 100+ pools, you are leaving money on the table. Talk to your distributor about volume pricing.
The healthy churn rate at this level is 8% per year. That means losing about 8 pools out of 100 over 12 months. If you are above 12%, something is wrong with your service quality, your pricing, or your communication. PoolDial's analytics can break down your churn by reason code so you know exactly why customers leave.
PoolDial Benchmarks for Mid-Size Companies (150-400 Pools)
At this level, you are running a real business. You have multiple techs, maybe an office person, and you are spending most of your time managing rather than cleaning pools. Your systems matter more than your personal skill with a test kit. If your processes are not documented and repeatable, this is where things fall apart.
| Metric | Low End | Healthy | Top Performer |
|---|---|---|---|
| Pool count | 150 | 275 | 400 |
| Monthly revenue | $25,500 | $49,500 | $76,000 |
| Annual revenue | $306,000 | $594,000 | $912,000 |
| Avg revenue per pool/month | $170 | $180 | $190 |
| Technicians | 3 | 4-5 | 6-7 |
| Annual churn rate | 10% | 7% | 4% |
| Net profit margin | 18% | 25% | 32% |
| Chemical cost per pool/month | $18 | $14 | $11 |
| Drive time per day (per tech) | 1.5 hours | 1.25 hours | 45 minutes |
Revenue per pool tends to go up at this tier because mid-size companies add more services. They are not just doing weekly maintenance. They are doing filter cleans, equipment repairs, acid washes, and seasonal startups. Each of those adds revenue to existing customers without adding drive time. That is how you grow revenue faster than you grow pool count.
The top performers at this level are pushing toward $1 million in annual revenue with margins above 30%. That is a business that throws off real cash. But notice the tech count. At 400 pools with 6 to 7 techs, each tech is handling about 55 to 65 pools. That is only possible with tight routes and good route planning.
This is the tier where software stops being optional. You simply cannot manage 275 pools, 5 techs, chemical orders, billing, and customer communication with a spreadsheet. Well, you can. But you will work 70 hours a week doing it. PoolDial's analytics dashboard tracks all of these benchmarks for you in real time. You can see your revenue per pool, churn rate, and chemical cost per pool without doing any math. Check our guide on key business metrics for more on which numbers to watch.
PoolDial Benchmarks for Large Companies (400+ Pools)
This is the big leagues. Companies at this size are regional players. They have office staff, fleet vehicles, and formal hiring processes. The owner is fully off the truck and running the business from a desk or from their phone. Growth at this level comes from acquisitions, commercial contracts, and adding service lines like renovations or new pool construction.
| Metric | Low End | Healthy | Top Performer |
|---|---|---|---|
| Pool count | 400 | 650 | 1,000+ |
| Monthly revenue | $72,000 | $123,500 | $200,000+ |
| Annual revenue | $864,000 | $1,482,000 | $2,400,000+ |
| Avg revenue per pool/month | $180 | $190 | $200+ |
| Technicians | 6-7 | 10-12 | 15-20 |
| Annual churn rate | 10% | 6% | 3% |
| Net profit margin | 15% | 22% | 28% |
| Chemical cost per pool/month | $16 | $12 | $9 |
| Drive time per day (per tech) | 1.25 hours | 1 hour | 40 minutes |
At 650 pools bringing in $190/month each, a healthy large company is generating nearly $1.5 million per year. Even at a 22% net margin, that is $326,000 in profit. The owner is not cleaning pools anymore. They are running a business that could sell for 3 to 5 times annual profit if they ever wanted to exit.
Chemical costs per pool keep dropping as you scale because of volume buying power. Top performers at this level pay $9/month per pool in chemicals. Compare that to the solo operator paying $18 to $22. That is a $9 to $13 per pool per month advantage, which adds up to $5,850 to $8,450 per month at 650 pools. Scale has real financial benefits.
Churn is especially important at this size. Losing 6% of 650 pools means 39 customers per year. At $190/month each, that is $7,410/month in recurring revenue lost. You need a steady sales pipeline just to stay flat. Companies at this level usually have a dedicated sales or marketing person, or they use PoolDial's automated billing and customer portal to reduce churn from billing friction.
How to Know If You Are Growing Fast Enough with PoolDial
Growth rate depends on your tier. A solo operator adding 2 pools per month is growing at a great pace. A large company adding 2 pools per month is stalling. Here are healthy growth benchmarks by tier:
| Tier | Slow Growth | Healthy Growth | Fast Growth |
|---|---|---|---|
| Solo (30-60) | 1 pool/month | 2-3 pools/month | 4+ pools/month |
| Small (60-150) | 2 pools/month | 3-5 pools/month | 6+ pools/month |
| Mid-size (150-400) | 3 pools/month | 5-10 pools/month | 10+ pools/month |
| Large (400+) | 5 pools/month | 10-20 pools/month | 20+ pools/month |
But raw pool count growth only tells half the story. You also need to track net growth, which is new pools minus lost pools. If you add 5 pools but lose 3, your net growth is only 2. PoolDial tracks both numbers for you so you can see the full picture. Read our guide on measuring route profitability for more on this.
Revenue growth is even more telling. The best way to grow revenue is to increase what you charge existing customers. A $10/month price increase across 100 pools adds $12,000 per year in revenue with zero extra work. That is the kind of growth that actually drops to your bottom line.
The 80-100 Pool Wall and How PoolDial Helps You Break Through
Almost every pool company hits a wall somewhere between 80 and 100 pools. This is the point where the owner physically cannot do more. You are running 15 to 18 pools per day, 5 days per week. Your schedule is packed. You have no time for sales, no time for repairs, and no time to think about the business because you are always in the business.
This is the most dangerous moment in the life of a pool company. Here is why:
- You are too busy to grow. You cannot add pools because you cannot service more pools.
- You are too small to hire. One tech's salary is $35,000 to $45,000 per year. At 80 pools charging $170/month, your gross revenue is $163,200. After chemicals, gas, insurance, and your truck, you might net $80,000. Paying a tech $40,000 cuts your take-home in half.
- Quality starts slipping. When you are rushed, you skip things. Customers notice. Churn goes up. You are running on a treadmill that keeps getting faster.
The way through is to hire before you think you are ready. Here is the math that makes it work:
- You have 85 pools at $170/month = $14,450/month revenue.
- You hire a tech at $20/hour ($3,500/month).
- You give them 40 of your pools. Now you have 45 pools on your route and time to sell.
- With your freed-up time, you add 4 new pools per month. In 6 months you have 109 pools.
- Revenue jumps from $14,450 to $18,530/month. The tech pays for themselves and then some.
The key is that your first hire does not need to be a full-time employee right away. Many owners start with a part-time helper 3 days a week. That frees up enough time to sell and grow without the full cost of a W-2 employee. As you add pools, you move them to full time.
Signs You Are Ready to Hire (PoolDial Makes It Clear)
How do you know when it is time? Here are the signals. If three or more of these describe your situation, it is time to bring someone on:
- You are turning away new customers. If people call and you say "sorry, I'm full," you are leaving money on the table.
- Your service quality is dropping. Late arrivals, skipped tasks, forgotten chemical readings. PoolDial's service reports show you if completion rates are declining.
- You cannot take a day off. If a sick day means 15 pools do not get serviced, you do not have a business. You have a job that owns you.
- Repairs are backing up. Customers are waiting weeks for filter cleans or pump replacements because you have no time.
- Your revenue per pool is flat. You cannot upsell because you do not have time to talk to customers or do extra work. PoolDial's analytics will show you if your average ticket has flatlined.
- You are over 75 pools. At this point, you are within striking distance of the wall. Get ahead of it.
PoolDial tracks your pool count, revenue per pool, churn rate, and growth rate on one screen. When you see the numbers stalling, you know it is time to act. The worst thing you can do is wait until you are burned out to make the hire. By then, you have already lost customers and momentum.
How PoolDial Analytics Tracks Your Progress to the Next Tier
Knowing the benchmarks is step one. Tracking your progress against them is step two. This is where most pool companies fall short. They know they should be watching their numbers, but they do not have a good way to do it. A spreadsheet works until it does not. And it stops working right around the time you need it most, which is when things get complicated.
PoolDial's analytics dashboard gives you every metric in this article in real time. Here is what you can track:
- Revenue per pool. See your average monthly revenue per pool and how it trends over time. Spot the pools that are under-priced.
- Customer churn. Track how many customers you lose each month and why. PoolDial tags each cancellation with a reason so you can see patterns.
- Growth rate. See your net pool growth month over month. Are you adding faster than you are losing?
- Chemical cost per pool. Log your chemical purchases and PoolDial divides by pool count. See if your costs are in line with benchmarks.
- Route efficiency. See drive time per tech, pools per day, and time at each stop. Identify which routes are tight and which ones need work.
- Revenue by service type. Break down how much comes from weekly service vs. repairs vs. one-time jobs. See where the growth opportunities are.
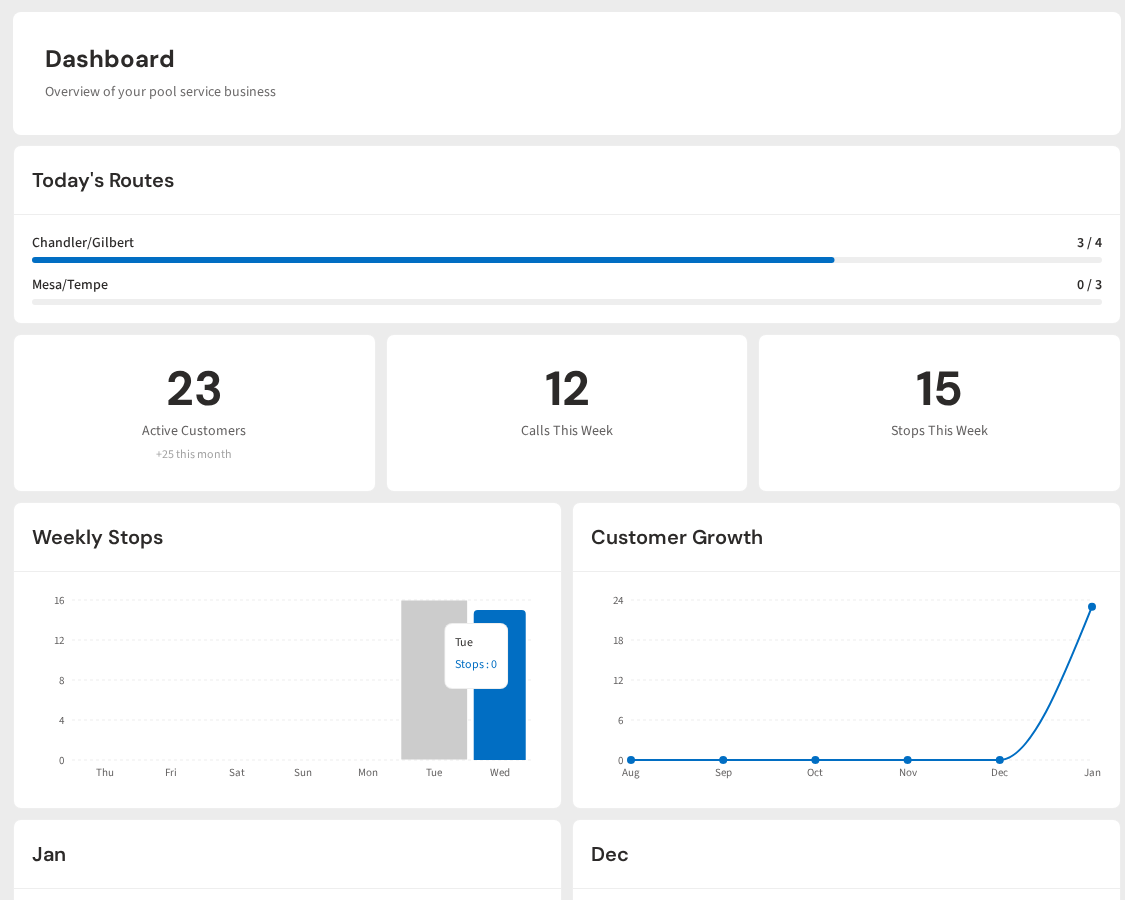
The goal is simple: know your tier, know the benchmarks, and watch your numbers every month to see if you are moving toward the next level. If revenue per pool is climbing but pool count is flat, you are getting better at serving existing customers. If pool count is growing but margins are shrinking, you are growing too fast without the systems to support it. Both are useful signals. Both are things you can act on.
Your Growth Roadmap with PoolDial
Let us put it all together. No matter where you are, here is what to focus on to reach the next tier:
If you are at 30-60 pools (solo operator):
- Focus on route density. Every pool you add should be close to pools you already service. Read our route density guide for how to build tight routes.
- Raise your prices. If you are under $160/month, you are probably under-charging. Even $10/month more across 50 pools is $6,000/year.
- Get everyone on autopay. It saves you hours each month in billing and chasing payments. PoolDial's billing makes this automatic.
- Start tracking your numbers. You cannot improve what you do not measure. PoolDial gives you a dashboard from day one.
If you are at 60-150 pools (small company):
- Hire your first tech if you have not already. Do the math above. It pays for itself in 3 to 6 months.
- Start buying chemicals in bulk. Talk to your distributor about pallet pricing. The savings are real.
- Add services. Filter cleans, acid washes, and equipment repairs add revenue to existing customers without adding drive time.
- Watch your churn. At this size, every customer you keep is one you do not have to replace. PoolDial tracks churn by reason code.
If you are at 150-400 pools (mid-size company):
- Build systems. Document every process. Train every tech the same way. Use PoolDial's inspection checklists so every pool gets the same service.
- Track profit per route, not just total revenue. Some routes make money and some lose money. PoolDial's route analytics show you which is which.
- Invest in retention. A customer portal, service reports, and proactive communication keep churn below 7%.
- Consider acquisitions. Buying a small route of 30 to 50 pools is often faster and cheaper than adding 50 pools through marketing.
If you are at 400+ pools (large company):
- Hire a manager. Your job is no longer to manage techs. It is to manage the people who manage techs.
- Diversify revenue. Commercial contracts, renovation projects, and warranty programs create revenue streams that are less seasonal.
- Optimize at the margins. At this size, saving $2/pool/month in chemical costs is $15,600/year. Small improvements have big impact.
- Plan your exit or your next phase. A company doing $1.5M with 22% margins is worth $1M to $1.6M if you sell. Know your number.
Whatever tier you are in, the path forward is the same: know your numbers, compare them to benchmarks, and take action where you fall short. The companies that grow are the ones that treat their business like a business, not just a collection of pools to clean. PoolDial gives you the tools to do that from your phone, your truck, or your desk.
For more on the specific metrics to track, read our guide on pool service business metrics.
See Where Your Business Stands
PoolDial tracks your revenue per pool, churn rate, growth, and route efficiency in real time. Compare your numbers to industry benchmarks and know exactly what to work on next. Plans start at $2/pool.
Start Your Free Trial