
How to Measure Pool Route Profitability Per Stop


You know how much money comes in every month. You can look at your bank account and see the total. But do you know how much profit you make on each pool? Not just how much you charge. How much you actually keep after all the costs.
Most pool service owners do not know this number. They know their total revenue. They know their total expenses. But they have no idea which pools are making them money and which ones are slowly draining their business. And that is a problem, because you might have 10 pools that are losing money every single month and not even know it.
This guide will show you exactly how to figure out your profit per stop. We will walk through the full cost formula, do the math with real numbers, and show you what to do when a pool is not making you money. We will also show you how PoolDial's analytics dashboard does all of this for you automatically.
Key Takeaways
- Revenue per pool is not profit per pool. A $160/month pool can lose you money if the costs are too high.
- The full cost formula has four parts: labor, chemicals, drive time, and overhead.
- Drive time is the hidden killer. A pool that is 15 minutes out of the way can cost you $20+ per visit just in travel.
- Every pool pro should know their cost per stop. Use our cost per pool calculator to find yours.
- PoolDial calculates profit per stop automatically. No spreadsheet needed.
Why Most Pool Pros Do Not Know Their PoolDial Profit Per Stop
Here is the honest truth. When you are running 80 pools a week, you are not thinking about the profit on each one. You are thinking about getting the route done, keeping the water clear, and getting home at a decent hour. The idea of sitting down with a spreadsheet and calculating your cost per stop for every single pool sounds like a nightmare.
So most people just look at the big picture. Total revenue minus total expenses equals profit. And if that number is positive, they figure things are fine.
But this hides something important. Inside that "fine" total, there are almost always a handful of pools that are losing money. Maybe it is the pool that is 20 minutes away from your nearest cluster. Maybe it is the one with the massive 40,000 gallon pool that eats through chemicals. Maybe it is the one you quoted at $120/month two years ago and never raised the price.
You would never know from looking at your total revenue. You can only see it when you look at each pool on its own.
The Full Cost Formula You Need for PoolDial Per-Stop Analysis
To figure out if a pool is making you money, you need to know what it costs to service that pool every month. Here is the formula:
Total Cost Per Pool = Labor Cost + Chemical Cost + Drive Time Cost + Overhead Allocation
Let us break down each piece.
1. Labor Cost Per Stop
This is the cost of the time someone spends at the pool. If you are a solo operator, this is your own time. If you have techs, this is what you pay them per hour.
To calculate labor cost per stop:
- Figure out the hourly cost of the person doing the work. If you pay a tech $22/hour and their payroll taxes and workers comp add about 25%, the real cost is about $27.50/hour.
- Time how long the stop takes. Not just the cleaning. Include setup, teardown, writing notes, and walking around the yard. A typical weekly maintenance stop takes 15 to 25 minutes.
- Multiply: if a stop takes 20 minutes and the labor cost is $27.50/hour, the labor cost per stop is $27.50 x (20/60) = $9.17 per visit.
- Multiply by visits per month: $9.17 x 4.33 visits = $39.70/month in labor.
For solo operators, you need to decide what your time is worth. Many people skip this step because "I am not paying myself a wage." But your time has value. If you could be doing a repair job for $150/hour or cleaning a pool for effectively $30/hour, that pool is costing you the difference. A good starting point is $35 to $50/hour for owner-operator time.
2. Chemical Cost Per Stop
This is the cost of every chemical you put in the pool. Chlorine tabs, liquid chlorine, acid, shock, algaecide, and anything else. PoolDial's chemical tracking logs exactly what goes into each pool, so this number is easy to find.
Average chemical costs vary a lot by pool size and condition:
- Small pool (10,000 gallons), good condition: $15 to $25/month in chemicals
- Medium pool (20,000 gallons), normal condition: $25 to $40/month
- Large pool (35,000+ gallons) or problem pool: $40 to $70/month
The key word there is "average." Some months you barely use anything. Other months you need to shock the pool twice because the kids had a pool party. Track your chemicals per pool over 3 to 6 months to get a good average.
3. Drive Time Cost Per Stop
This is the one most pool pros forget. It is also the one that makes the biggest difference between a profitable pool and an unprofitable one.
Drive time cost includes:
- Fuel: At $4/gallon and 15 MPG for a service truck, you are spending about $0.27/mile just on gas.
- Vehicle wear: The IRS standard mileage rate is $0.70/mile in 2026, which covers gas, insurance, depreciation, and maintenance. Use this number if you want a simple all-in cost.
- Labor during drive time: If your tech is driving 10 minutes between stops, that is 10 minutes of paid labor producing zero revenue. At $27.50/hour, that is $4.58 in wasted labor per drive.
To calculate drive time cost per stop, you need to know the average drive time to and from each pool. PoolDial's route tracking measures this automatically with GPS.
4. Overhead Allocation Per Stop
Overhead is everything else that keeps your business running but is not tied to a specific pool. This includes:
- Software subscriptions (like PoolDial)
- Insurance (general liability, vehicle, workers comp)
- Phone and internet
- Marketing and advertising
- Office supplies, uniforms, equipment replacement
- Accounting and bookkeeping
To allocate overhead per stop, add up all your monthly overhead costs and divide by the total number of stops you do per month.
For example: if your total monthly overhead is $2,400 and you service 80 pools per week (about 347 stops per month), your overhead per stop is $2,400 / 347 = $6.92 per stop, or about $29.95 per pool per month.
PoolDial Worked Example: A Pool That Makes Money vs. One That Loses Money
Let us look at two real examples. Both pools charge $160/month. Both seem the same on the surface. But one makes you $48/month and the other loses you $5/month.
Pool A: The Profitable One
| Cost Category | Per Visit | Per Month (4.33 visits) |
|---|---|---|
| Labor (18 min at $27.50/hr) | $8.25 | $35.72 |
| Chemicals (15,000 gal, good shape) | $4.62 | $20.00 |
| Drive time (4 min from prev stop, 2.1 miles) | $3.28 | $14.20 |
| Overhead allocation | $6.92 | $29.95 |
| Credit card processing (2.9%) | -- | $4.64 |
| Total Cost | $104.51 | |
| Revenue | $160.00 | |
| Profit | $55.49/month |
Pool A is a winner. It is close to other stops on the route. It is a normal size pool in good shape. The chemicals are low. The visit is quick. You keep $55.49 out of every $160. That is a 34.7% profit margin. This is the kind of pool you want more of.
Pool B: The Money Loser
| Cost Category | Per Visit | Per Month (4.33 visits) |
|---|---|---|
| Labor (28 min at $27.50/hr) | $12.83 | $55.57 |
| Chemicals (35,000 gal, lots of trees) | $10.85 | $47.00 |
| Drive time (14 min from prev stop, 8.5 miles) | $12.38 | $53.59 |
| Overhead allocation | $6.92 | $29.95 |
| Credit card processing (2.9%) | -- | $4.64 |
| Total Cost | $190.75 | |
| Revenue | $160.00 | |
| Loss | -$30.75/month |
Pool B is losing you $30.75 every month. And here is the thing: you would never know it from looking at your total revenue. The $160 comes in every month and it looks like income. But once you add up the drive time to get there, the extra chemicals for that oversized pool with all the trees, and the longer service time, you are paying to clean this pool.
Look at the drive time line. Pool B costs $53.59/month just in travel. That is almost 10 times what Pool A costs. This is why reducing drive time is one of the fastest ways to boost your profits.
Now imagine you have 5 pools like Pool B on your route. That is $153.75/month you are losing. Over a year, that is $1,845 gone. You would have been better off dropping those 5 pools and doing nothing with that time.
What to Do with Unprofitable Pools Using PoolDial Data
Once you find a pool that is losing money, you have three options. Let us go through each one.
Option 1: Raise the Price
This is the simplest fix. If Pool B from our example needs to be $190/month to break even, then you need to charge at least $200 to $210/month to make it worth your time. Use the service price calculator to figure out the right price.
How to have the conversation:
- Be honest. "Mrs. Johnson, we have looked at the cost of servicing your pool and our current price does not cover it. Your pool is larger than average and requires more chemicals and more time each visit."
- Give them a number. "We need to move your monthly rate to $210 starting next month."
- Give them a choice. "If you would like to stay at a lower price point, we can move to every-other-week service instead."
Will some customers leave? Yes. And that is okay. A customer who leaves at $160/month was costing you $30.75/month. You are better off without them. The ones who stay at $210 are now profitable.
Option 2: Fix the Route Density
If the big cost driver is drive time, the fix is not always raising the price. Sometimes it is fixing your route density.
Maybe Pool B is 14 minutes away from the nearest stop because it is the only pool you have in that neighborhood. But what if you picked up 3 more pools on that same street? Now the drive to Pool B is shared across 4 pools instead of 1. The drive time cost per stop drops from $53.59/month to about $13.40/month. That alone turns Pool B from a $30.75 loss into a $9.44 profit.
PoolDial's route map shows you exactly where your density gaps are. Look for isolated pools that are far from any cluster. Then focus your marketing on those neighborhoods to fill in the gaps.
Option 3: Let the Pool Go
Sometimes a pool just does not work. The customer will not accept a price increase. There is no density to build around it. The drive is too far. The pool is too big. The trees dump too many leaves.
In that case, let it go. Be professional about it. Give 30 days notice. Recommend another company in their area. And fill that slot with a pool in your density zone that actually makes you money.
This is hard for a lot of pool pros. Every pool feels like income. Dropping one feels like going backward. But dropping a pool that loses $30/month and replacing it with one that makes $50/month is a $80/month improvement. Do that with 5 pools and you just added $4,800/year to your bottom line without adding a single extra stop to your week.
How PoolDial Calculates Profit Per Stop Automatically
You could do all of this math by hand. Grab a spreadsheet, time every stop, track every chemical, log every drive. But realistically, you are not going to do that for 80 pools every week. Nobody has that kind of time.
That is where PoolDial's analytics dashboard comes in. It does the math for you in real time.
Here is what PoolDial tracks automatically:
- Time at each stop. The app logs when your tech arrives and when they leave. No manual timers needed.
- Drive time between stops. GPS tracks the route and calculates the drive time and distance to every pool.
- Chemicals used. Your tech logs chemicals during the visit. PoolDial knows the cost of each product based on your purchase prices.
- Revenue per pool. Pulled straight from billing. No double entry.
- Overhead allocation. You set your monthly overhead once and PoolDial divides it across your stops.
The result is a profit number for every single pool on your route. You can sort by profit, sort by margin, and instantly see which pools are your best performers and which ones are dragging you down.
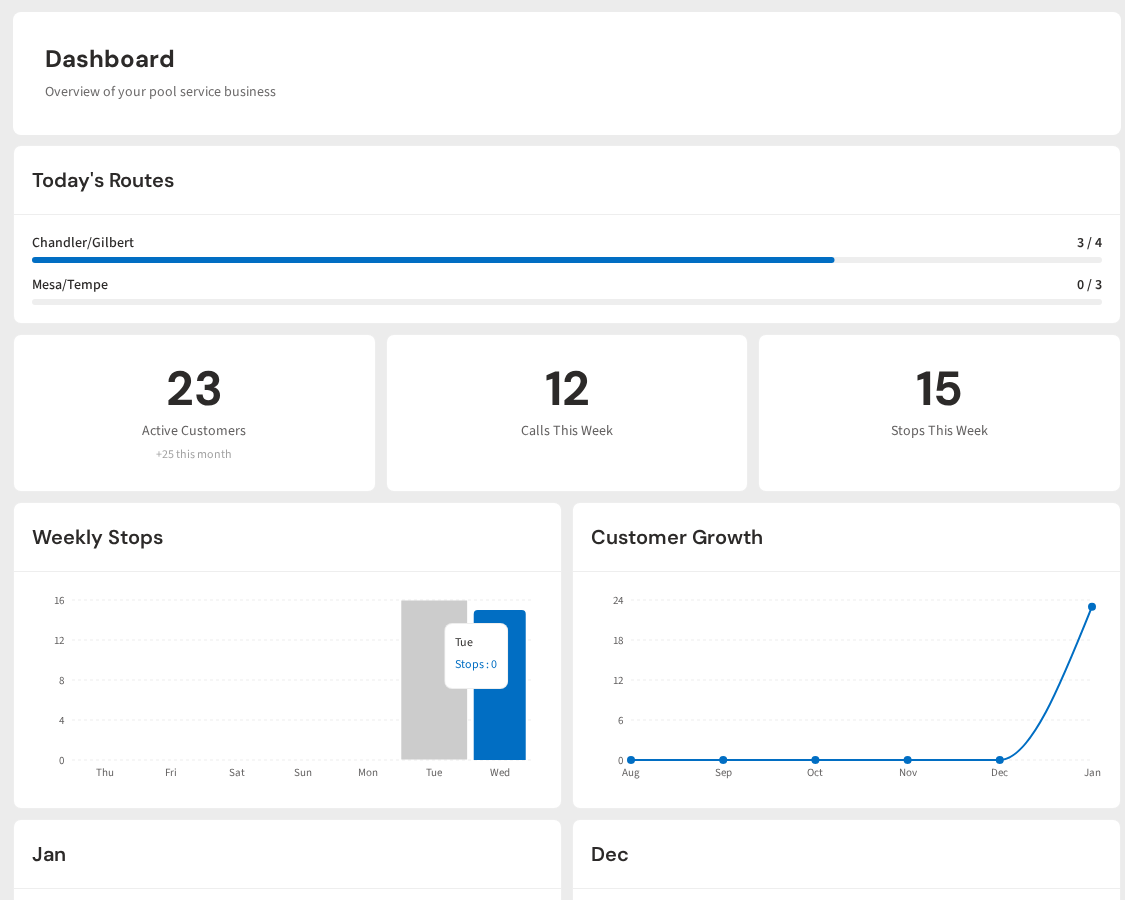
You can also see trends over time. Maybe a pool was profitable 6 months ago but chemical costs have gone up 30% since then. PoolDial will show you that the margin is shrinking before it turns negative. That gives you time to raise the price before you start losing money.
Key PoolDial Metrics Every Pool Pro Should Track
Profit per stop is the most important number, but it is not the only one. Here are the key metrics you should be watching every month. For a complete list, check out our guide on pool service business metrics.
| Metric | What It Tells You | Good Target |
|---|---|---|
| Profit per stop | How much you keep after all costs for each pool | $30 to $60/month |
| Profit margin per stop | Profit as a percentage of revenue | 25% to 40% |
| Average drive time | How tight your routes are | Under 7 minutes between stops |
| Cost per stop | Your total all-in cost to service one pool | Under $100/month |
| Chemical cost per stop | How much product each pool uses | $20 to $35/month |
| Revenue per hour | How much your route earns per hour of work (including drive time) | $65 to $100/hour |
| Stops per day | Route efficiency | 16 to 22 stops per day |
Use the cost per pool calculator to see where you stand right now. Then use PoolDial to track these numbers going forward so you catch problems early.
How to Use PoolDial Profit Data to Grow Smarter
Once you know your profit per stop, you can make better decisions about almost everything in your business. Here is how.
Decide Where to Market
Instead of advertising everywhere and hoping for the best, focus on the neighborhoods where you already have strong density. A new pool in a neighborhood where you have 8 pools already is almost pure profit because the drive time cost is close to zero. A new pool in a neighborhood 20 minutes away is barely worth having.
Look at your PoolDial route map. Find the clusters. Market there first. Door hangers, yard signs, NextDoor posts. Fill in the gaps in your existing routes before you expand into new areas.
Decide When to Raise Prices
Price increases should not be based on gut feeling. They should be based on data. If your average profit margin is 35% but 15 of your pools are under 15%, those 15 pools need a price increase. PoolDial shows you exactly which ones.
A good rule: review your profit per stop every quarter. Any pool below 15% margin gets a price review. Any pool below 0% margin gets an immediate conversation with the customer.
Decide Whether to Take on a New Pool
When a potential customer calls, the first question should not be "how much do I charge?" The first question should be "where is this pool and what will it cost me to service it?"
If the pool is in one of your dense neighborhoods, you can price it lower because your costs will be lower. If it is 15 minutes from your nearest cluster, you need to price it higher or pass on it entirely. Use the service price calculator to set a profitable price for any new pool.
Decide Whether to Buy a Route
If you are thinking about buying a pool route, profit per stop is the most important number to look at. A route with 60 pools at $150/month sounds great. That is $9,000/month in revenue. But if the pools are spread across three cities and the average drive time is 18 minutes, the costs might eat most of that revenue.
Before you buy, map out every pool. Calculate the drive times. Estimate the costs. If the profit per stop is below $20/month, the route is overpriced or the pools need to be reorganized.
Common PoolDial Profitability Mistakes to Avoid
As you start tracking profit per stop, watch out for these common traps.
Mistake 1: Not Counting Your Own Time
If you are a solo operator and you skip the labor cost because "I do not pay myself," your numbers will be wrong. Your time has value. If you do not put a dollar amount on it, you will trick yourself into thinking unprofitable pools are profitable.
Pick a number. $40/hour is a reasonable starting point for owner-operator labor. Use it. Even if you are not paying yourself that much right now, you should be, and your pricing should reflect it.
Mistake 2: Ignoring Drive Time
We said it earlier but it is worth repeating. Drive time is the biggest hidden cost in pool service. A pool that is 5 minutes away costs about $13/month in drive time. A pool that is 15 minutes away costs about $40/month. That $27/month difference is the difference between a great pool and a terrible one.
Mistake 3: Using Averages Instead of Actuals
It is tempting to say "my average chemical cost is $25/month" and use that for every pool. But averages hide the outliers. That 40,000 gallon pool with the oak tree dropping leaves every week is costing you $55/month in chemicals, not $25. Use actual per-pool data whenever you can. PoolDial tracks this for you.
Mistake 4: Only Looking at Revenue
A $200/month pool is not automatically better than a $140/month pool. If the $200 pool costs $190 to service and the $140 pool costs $90 to service, the cheaper pool makes you more money. Revenue is just the starting point. Profit is what matters.
Mistake 5: Never Raising Prices
Costs go up every year. Gas, chemicals, insurance, labor. If you do not raise prices to match, your profit margin shrinks every year. Check your per-stop profitability every quarter and adjust. Even a $5/month increase across 80 pools adds $4,800/year to your bottom line.
Start Tracking Your PoolDial Profit Per Stop Today
You do not need to be a math person to do this. You just need to know four numbers for each pool: what you spend on labor, chemicals, drive time, and overhead. Add them up. Subtract from revenue. That is your profit.
If you want to do it the easy way, PoolDial does it all for you. Every stop is tracked. Every chemical is logged. Every drive is measured. And every month, you get a clear picture of which pools are making you money and which ones are not.
Start with your worst pool. The one that is the farthest away, or the one that always takes too long, or the one you have not raised the price on in two years. Run the numbers. You might be surprised at what you find.
Then do it for every pool. Sort by profit. Fix the bottom 10%. And watch your overall margins go up without adding a single extra stop to your week.
For more on building a profitable pool route, check out our guides on pool service business metrics, reducing drive time, and route density strategy.
See Your Profit Per Pool in Seconds
PoolDial tracks labor, chemicals, drive time, and revenue for every stop. See which pools make money and which ones cost you. Plans start at $2/pool.
Start Your Free Trial