
Key Metrics Every Pool Service Owner Should Track


Most pool service owners start the same way. You buy a truck, load up some chemicals, and start cleaning pools. You get busy. You add more pools. You hire someone. And one day you look up and think: "Am I even making money?"
The truth is, a lot of pool pros have no idea. They know they're busy. They know money comes in. But they don't know which pools make money, which ones lose money, or whether the business is growing or shrinking. They're flying blind.
You don't need a finance degree to fix this. You just need to track a few key numbers. This guide will show you the 8 most important metrics for your pool service business. For each one, you'll learn what it is, how to figure it out, what good looks like, and how PoolDial's analytics tracks it for you.
Key Takeaways
- Track 8 numbers. Revenue, cost per pool, profit per pool, customer count, churn rate, average revenue per customer, drive time, and chemical cost.
- Know your cost per pool. This is the single most important number. If you don't know it, you can't set the right price.
- Watch your churn rate. Losing 2 customers a month is 24 a year. That's a big hole to fill.
- Use real numbers. Guessing is not tracking. Write it down or let software do it.
- Check monthly. Look at your numbers on the first of every month. 15 minutes can save your business.
1. Monthly Revenue and MRR with PoolDial
Monthly revenue is the total amount of money that comes into your business each month. It's the starting point for everything else. If you don't know this number, stop reading and go add it up right now.
There are two types of revenue in pool service:
- Recurring revenue (MRR). This is your monthly service income. The pools you clean every week or every other week. This is your bread and butter. It's steady and it comes in every month.
- One-time revenue. This is repairs, filter cleans, acid washes, equipment installs, and other jobs you bill once. It's less steady but can add up fast.
MRR stands for Monthly Recurring Revenue. It's just a fancy way of saying "how much do I make every month from regular service." If you service 80 pools at $160 each, your MRR is $12,800.
How to calculate it: Add up every active customer's monthly service rate. That's your MRR. For total monthly revenue, add in any one-time jobs you billed that month.
| Metric | Example | What It Tells You |
|---|---|---|
| MRR | 80 pools x $160 = $12,800 | Your baseline income each month |
| One-time revenue | 3 filter cleans ($150 each) + 1 pump install ($800) = $1,250 | Extra income on top of service |
| Total monthly revenue | $12,800 + $1,250 = $14,050 | Everything your business brought in |
What good looks like: Your MRR should go up every month, even if it's only by one or two pools. A solo operator doing well usually has MRR between $10,000 and $20,000. A two-truck operation should be between $20,000 and $40,000.
What bad looks like: If your MRR is flat or going down for three months in a row, something is wrong. You're losing customers faster than you're adding them. Time to dig into your churn rate (more on that below).
PoolDial's analytics dashboard shows your MRR in real time. You can see it go up when you add a customer and go down when you lose one. No spreadsheet needed. It also breaks out recurring vs. one-time revenue so you can see how much of your income is stable.
2. Cost Per Pool with PoolDial
This is the most important number in your business. If you only track one thing, track this. Cost per pool tells you how much it costs you to service each pool every month. If it costs you $100 to service a pool and you charge $160, you make $60. If it costs you $130, you only make $30. Same pool, same work, very different outcome.
Cost per pool has four parts:
- Labor. What you pay yourself or your tech per pool. If a tech makes $20/hour and does 4 pools per hour, labor cost is $5 per pool. If they do 2 pools per hour, it's $10 per pool. Speed matters.
- Chemicals. Chlorine tabs, liquid chlorine, acid, shock, algaecide. For a normal residential pool, this runs $15 to $30 per month. Pools with problems cost more.
- Drive time. Gas, truck wear, and the time spent driving between stops. A pool that's 2 minutes from the last stop costs almost nothing to drive to. A pool that's 20 minutes away costs a lot. We'll cover this more below.
- Overhead. Insurance, software, phone, truck payment, marketing, and everything else that keeps the business running. Take your total monthly overhead and divide by number of pools. If your overhead is $2,000/month and you have 80 pools, that's $25 per pool.
How to calculate it:
| Cost Category | Monthly Total | Per Pool (80 pools) |
|---|---|---|
| Labor | $4,800 | $60.00 |
| Chemicals | $1,600 | $20.00 |
| Drive time (gas + wear) | $640 | $8.00 |
| Overhead | $2,000 | $25.00 |
| Total cost per pool | $9,040 | $113.00 |
What good looks like: Your cost per pool should be less than 70% of what you charge. If you charge $160, your cost should be under $112. That gives you at least a 30% profit margin. The best pool companies run at 35-45% margins.
What bad looks like: If your cost per pool is over 80% of your price, you're working for almost nothing. At $160/pool with a $140 cost, you make $20 per pool. On 80 pools, that's only $1,600/month in profit. That's not a business. That's a hobby.
Use PoolDial's cost per pool calculator to figure yours out right now. It takes about 5 minutes. The analytics dashboard also tracks this over time, so you can see if your costs are going up or down.
3. Profit Per Pool with PoolDial
Profit per pool is simple math. Take what you charge and subtract your cost per pool. That's your profit. But simple doesn't mean easy. Most pool pros have never done this math for each pool on their route.
How to calculate it: Monthly service price minus cost per pool equals profit per pool.
Here's what three different pools might look like on the same route:
| Pool | Price | Cost | Profit | Margin |
|---|---|---|---|---|
| Pool A (small, close, easy) | $140 | $85 | $55 | 39% |
| Pool B (medium, average) | $160 | $113 | $47 | 29% |
| Pool C (large, far away, lots of trees) | $180 | $165 | $15 | 8% |
Pool C charges the most but makes the least. It's far from the rest of the route, the yard is full of trees that drop leaves, and it takes twice as long to clean. You might think that pool is your best customer because they pay $180. But they're actually your worst.
What good looks like: You want every pool on your route to make at least $40 in profit. Ideally $50 or more. If you have 80 pools at $50 profit each, that's $4,000/month in your pocket before taxes.
What bad looks like: Any pool under $20 profit is a red flag. Any pool at $0 or negative profit should get a price increase or be dropped. It feels wrong to drop a customer, but servicing a pool at a loss means you're paying them for the right to clean their pool.
PoolDial's billing and analytics work together here. You can see revenue per customer alongside route data and time-on-site to spot your least profitable stops. The service price calculator can help you figure out the right price for each pool based on its size, distance, and difficulty.
4. Customer Count and Growth Rate with PoolDial
Customer count is the number of active, paying customers you have right now. Growth rate is how fast that number is going up or down. Both are easy to track. Both tell you a lot about where your business is headed.
How to calculate growth rate: Take your customer count at the end of the month. Subtract your count at the start of the month. Divide by the start count. Multiply by 100. That's your monthly growth rate.
Example: You started April with 78 customers. You added 5 new ones. You lost 2. You ended with 81. Your growth rate is (81 - 78) / 78 x 100 = 3.8%.
| Growth Rate | What It Means | Annual Result (starting at 80) |
|---|---|---|
| 5% per month | Very strong growth. Hard to keep up. | 143 pools by year end |
| 2-3% per month | Healthy, steady growth. | 101-109 pools by year end |
| 0% per month | Flat. Adding and losing the same amount. | Still 80 pools |
| -2% per month | Shrinking. Something is wrong. | 63 pools by year end |
What good looks like: For a growing business, 2-5% monthly growth is great. That's adding 2 to 4 new customers per month on a base of 80. If you're happy with your size, 0% growth is fine as long as your churn is also low.
What bad looks like: Negative growth for two or more months in a row. If you're losing more than you're gaining, you need to find out why. Is it price? Service quality? Competition? PoolDial's customer management tracks when customers leave and lets you tag the reason, so you can spot patterns.
PoolDial shows your customer count right on the analytics dashboard. You can see a chart of how it's changed over time. You can also see which months you grow and which months you shrink. For many pool companies, you lose customers in the fall and gain them in the spring. That's normal. What matters is the year-over-year trend.
5. Churn Rate with PoolDial
Churn rate is the percentage of customers you lose each month. It's the opposite of growth. And it's the number most pool pros ignore until it's too late.
How to calculate it: Take the number of customers who canceled this month. Divide by the number of customers at the start of the month. Multiply by 100.
Example: You started the month with 80 customers. 3 canceled. Your churn rate is 3 / 80 x 100 = 3.75%.
That might not sound like a lot. But 3.75% per month is 45% per year. That means if you don't add any new customers, you'll go from 80 pools to 44 pools in 12 months. Churn adds up fast.
| Monthly Churn | Annual Loss | Effect on 80-Pool Route |
|---|---|---|
| 1% (less than 1 per month) | ~11% | Lose about 9 pools per year. Easy to replace. |
| 2% (about 2 per month) | ~21% | Lose about 17 pools per year. Need steady marketing. |
| 4% (about 3 per month) | ~39% | Lose about 31 pools per year. Red flag. |
| 6%+ (5+ per month) | ~53%+ | Business is shrinking fast. Fix this now. |
What good looks like: Under 2% monthly churn. That means you lose about 1-2 customers per month on an 80-pool route. Some of that is normal. People move, sell their house, or fill in their pool. You can't stop all of it.
What bad looks like: Over 4% monthly churn is a problem. If you're losing 3 or more customers a month, you need to figure out why. Common reasons: poor service quality, prices too high for the area, slow response to problems, or a new competitor in town.
PoolDial tracks churn automatically. Every time a customer is marked inactive or cancels, it shows up in your analytics. You can see your monthly churn rate on a chart. You can also see which customers left and why, so you can fix the root cause instead of guessing.
6. Average Revenue Per Customer with PoolDial
Average revenue per customer (ARPC) tells you how much each customer is worth to your business. It's your total monthly revenue divided by your number of customers.
How to calculate it: Total monthly revenue / number of active customers = ARPC.
Example: $14,050 in total revenue / 80 customers = $175.63 per customer.
But the real power of ARPC is when you break it down. Some customers pay you $140/month for basic weekly service. Others pay you $160/month for service plus $150 for a quarterly filter clean plus $800 for a pump replacement. That second customer is worth $460 that month.
| Customer Type | Monthly Service | Extra Services | Annual Value |
|---|---|---|---|
| Service-only customer | $160 | $0 | $1,920 |
| Service + filter cleans | $160 | $150 x 4 = $600 | $2,520 |
| Full-service customer | $160 | $600 filters + $400 repairs | $2,920 |
The full-service customer is worth $1,000 more per year than the service-only customer. Same pool. Same drive time. But $1,000 more in your pocket because you offered more services.
What good looks like: ARPC over $175/month. This means your customers are buying more than just basic service. You're doing filter cleans, repairs, and equipment work on top of regular maintenance.
What bad looks like: ARPC under $140/month. This means your prices are too low, you're not offering extra services, or both. If your ARPC is low, start offering quarterly filter cleans, acid washes, and equipment checks. Every extra service you sell raises your ARPC without adding a new stop to your route.
PoolDial's billing system tracks revenue per customer over time. You can sort your customer list by total revenue to see who your most and least valuable customers are. You can also see which types of extra services are bringing in the most money.
7. Drive Time Per Day with PoolDial
Drive time is the silent killer of pool service profits. Every minute you spend in your truck is a minute you're not cleaning pools. And you're still paying for gas, truck wear, and labor during that time.
How to calculate it: Track how many minutes you drive on a full route day. Include the drive from your house to the first stop, the drive between every stop, and the drive home at the end. Add it all up.
Here's how drive time affects your day:
| Scenario | Pools per Day | Drive Time | Clean Time | Total Day |
|---|---|---|---|---|
| Tight route | 20 | 1.5 hours | 5 hours | 6.5 hours |
| Average route | 18 | 2.5 hours | 5 hours | 7.5 hours |
| Spread-out route | 15 | 3.5 hours | 5 hours | 8.5 hours |
Look at the difference. The tight route and the spread-out route both spend 5 hours cleaning pools. But the tight route finishes 2 hours earlier because there's less driving. Or, they can use those 2 hours to clean 5 more pools and make a lot more money.
What good looks like: Under 2 hours of drive time for 18-20 pools. That means your average drive between stops is about 5-6 minutes. This is only possible with a dense, well-planned route.
What bad looks like: Over 3 hours of drive time per day. If you're driving 10-15 minutes between stops, your route is too spread out. You're burning gas and time that should be spent cleaning pools.
PoolDial's route planning tool shows you exactly how much time you'll spend driving each day. It also helps you group stops by area so you can cut drive time. When a new customer calls, you can see right away if they fit into an existing route day or if they'll add a lot of extra driving. That helps you decide whether to take them on, and what to charge.
Here's a quick way to think about the cost of drive time. If your total truck cost (gas, insurance, payment, maintenance) is $1,200/month and you drive 60 hours a month, your truck costs $20/hour. Every 10 minutes of extra driving between stops costs you $3.33. On 20 stops, that's $66 per day wasted. Over a month, that's over $1,300 gone.
8. Chemical Cost Per Pool with PoolDial
Chemical cost is the second biggest variable cost after labor. It changes from pool to pool and month to month. A pool in good shape might cost $12/month in chemicals. A pool with cyanuric acid problems or heavy algae can cost $40 or more.
How to calculate it: Track how much you spend on chemicals each month. Divide by the number of pools you service. That gives you the average. But the average hides a lot. You also want to know the cost for each pool.
| Chemical | Monthly Cost (per pool avg) | Notes |
|---|---|---|
| Chlorine (tabs or liquid) | $8 - $15 | Biggest cost. Liquid is cheaper but heavier. |
| Muriatic acid | $3 - $6 | For pH control. Some pools need more. |
| Shock / cal-hypo | $2 - $5 | Not every visit. As needed. |
| Specialty (algaecide, CYA, etc.) | $0 - $10 | Only when needed. Can spike costs. |
| Total average | $15 - $30 | Depends on pool size, location, and condition |
What good looks like: Chemical cost under $20 per pool per month on average. This means your pools are mostly in good shape and you're buying chemicals in bulk. If you can get your chemical cost to $15 per pool, that's an extra $400/month on 80 pools compared to $20 per pool.
What bad looks like: Chemical cost over $30 per pool per month on average. This usually means one of three things: you're buying retail instead of wholesale, you have pools that need a lot of extra treatment, or you're using more chemicals than needed because you're not testing properly.
Ways to cut chemical costs:
- Buy in bulk. A pallet of chlorine tabs is much cheaper per pound than buying a bucket at a time from the supply house.
- Switch to liquid chlorine. It's cheaper per gallon of active chlorine than tabs for most pool sizes. The trade-off is weight and handling.
- Test properly. If you add chemicals without testing first, you'll over-treat some pools and under-treat others. Both cost you money.
- Fix problem pools. A pool that needs shock every visit has a root cause problem like bad circulation, high CYA, or not enough run time. Fix the root cause and chemical costs drop.
PoolDial's chemical tracking logs what you add at every stop. Over time, it shows you which pools use the most chemicals and which ones are low-cost. That data helps you price pools correctly. A pool that uses $35/month in chemicals should be priced higher than one that uses $12.
Putting It All Together: Your PoolDial Dashboard
These 8 numbers paint a full picture of your business. Here's what a healthy 80-pool operation looks like when you put them all in one place:
| Metric | Healthy Target | Warning Sign |
|---|---|---|
| Monthly Revenue | $12,000 - $16,000 | Under $10,000 or falling |
| Cost Per Pool | Under $112 (70% of price) | Over $128 (80%+ of price) |
| Profit Per Pool | $40 - $60+ | Under $20 |
| Customer Count | Growing 2-3%/month | Flat or shrinking |
| Churn Rate | Under 2%/month | Over 4%/month |
| Avg Revenue Per Customer | Over $175/month | Under $140/month |
| Drive Time Per Day | Under 2 hours | Over 3 hours |
| Chemical Cost Per Pool | Under $20/month | Over $30/month |
If most of your numbers are in the "Healthy Target" column, you're running a strong business. If several are in the "Warning Sign" column, it's time to make changes. Start with cost per pool and churn rate. Those two numbers have the biggest effect on your bottom line.
Here's a real example. Say your 80-pool route has an average price of $160 and an average cost of $120. That's $40 profit per pool. Your total monthly profit is $3,200. Now, if you cut your cost per pool by just $10 (from $120 to $110), your profit goes to $50 per pool. That's $4,000/month. An extra $800 per month, or $9,600 per year, from a $10 improvement.
Or think about churn. If you lose 3 customers a month instead of 1, that's 2 extra customers gone. At $160/month each, that's $320/month in lost revenue. Over a year, that's $3,840 in lost income. And you have to spend time and money to replace those customers. Cutting churn from 3 to 1 customer per month could be worth $5,000 or more per year when you count marketing costs.
The point is this: small changes in your numbers lead to big changes in your bank account. But you can only make those changes if you track the numbers in the first place.
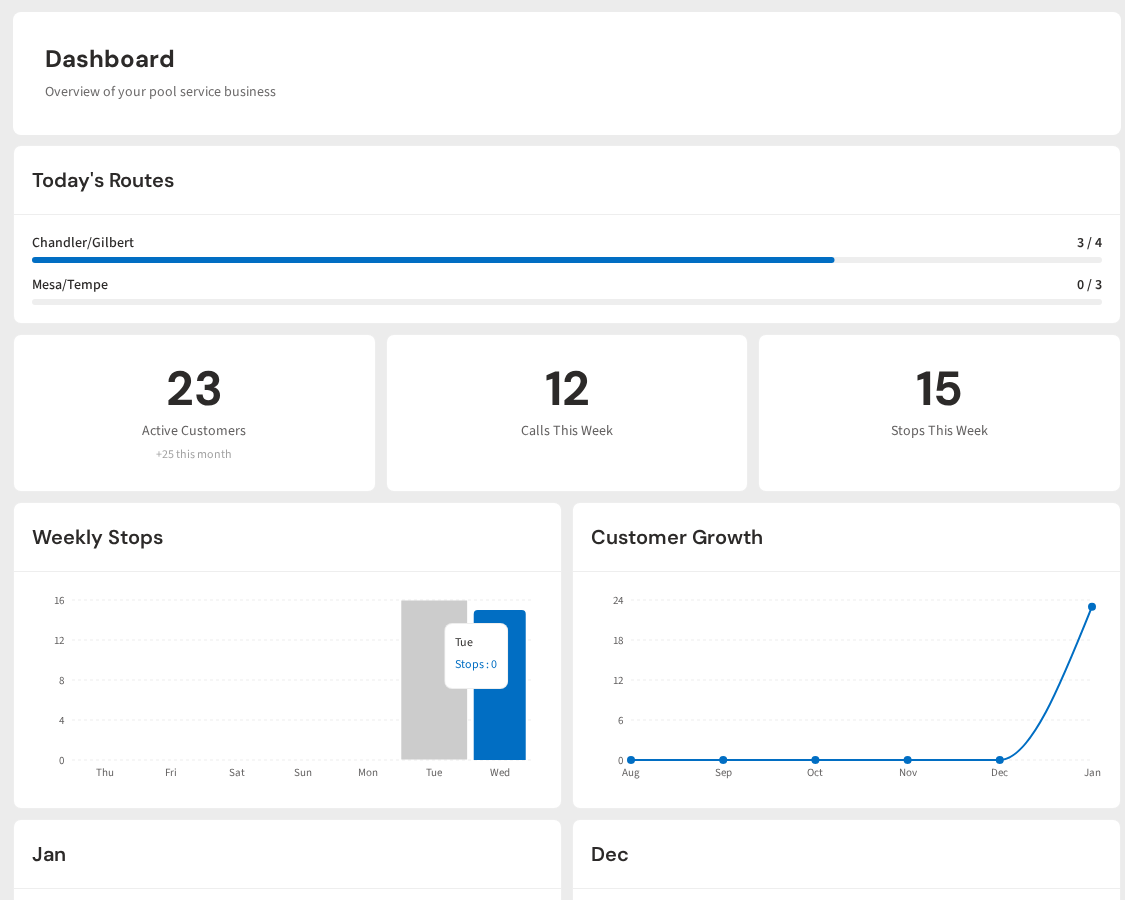
PoolDial tracks all 8 of these metrics automatically. No spreadsheets. No end-of-month number crunching. Just open your analytics dashboard and see where you stand. You can check your numbers from your phone between stops or from your computer at the end of the day.
Every pool you add, every customer who leaves, every invoice paid, every route driven feeds into these numbers in real time. You'll know right away if something is off. And you can fix problems while they're small instead of finding out three months later that you've been losing money.
If you're not tracking these numbers today, start with one. Figure out your cost per pool this week. Use the cost per pool calculator to get a quick answer. Then work on the rest. Or, sign up for PoolDial and let the software do the tracking for you.
Know Your Numbers. Grow Your Business.
PoolDial tracks revenue, costs, churn, and every key metric in real time. No spreadsheets needed. See exactly where your business stands today. Plans start at $2/pool.
Start Your Free Trial