Enter revenue and costs by route day. See profit per stop and per day.
Free spreadsheet to see profit per route day and per stop so you can identify your most and least profitable routes.

Free. Just enter your email.
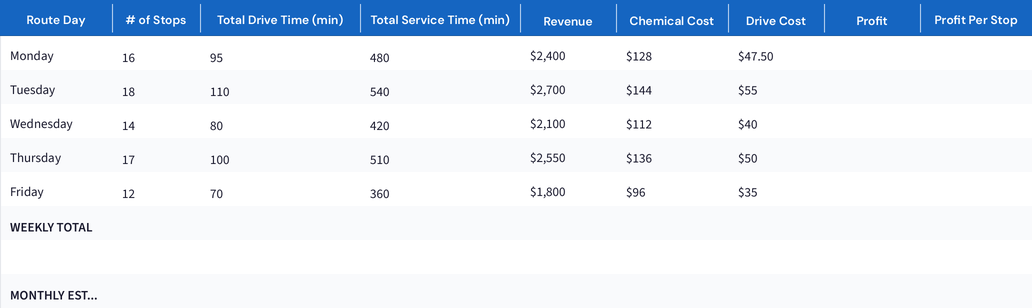
Revenue, chemical cost, drive cost, profit, and profit per stop for each day of the week.
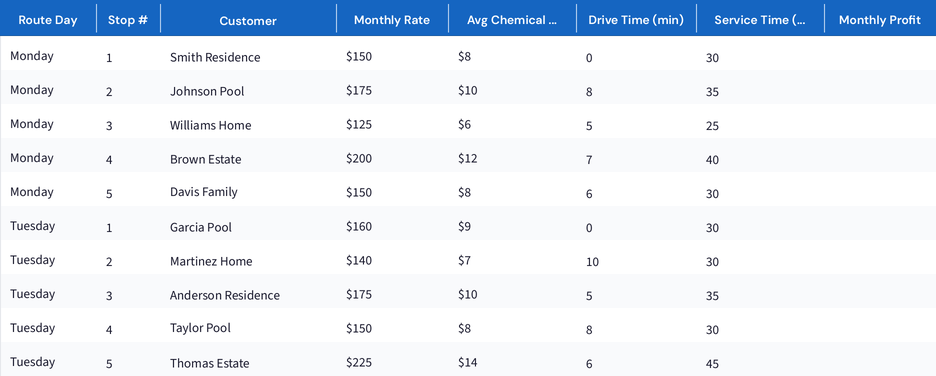
Per-stop breakdown with customer name, monthly rate, chemical cost, and monthly profit.
Not all route days are equally profitable. Differences in stop count, drive time, chemical usage, and customer rates create significant variation in daily profit. Tracking profitability by route day reveals which days generate strong returns and which ones need restructuring.
This spreadsheet tracks five metrics per route day: total stops, total drive time, total service time, revenue, and costs (chemicals + fuel). From these, it calculates daily profit and profit per stop — the most actionable metric for comparing route efficiency.
Profit per stop typically ranges from $20-40 for well-organized routes. Stops below $15 in profit are candidates for price increases or route reorganization. Stops that require excessive drive time (15+ minutes from the nearest cluster) should be evaluated for premium pricing or replacement.
Common improvements after reviewing route profitability data include: consolidating scattered stops onto fewer days, raising prices on isolated pools, dropping chronically unprofitable accounts, and reorganizing stop order to minimize backtracking. Even small changes — reducing average drive time by 3 minutes per stop — can add one additional stop per day, increasing daily revenue by $150+.
This spreadsheet was built to solve these exact problems.
Friday has 12 stops but you're making less than Tuesday's 18. You've never figured out why.
That pool 20 minutes away is eating your profit but you've never done the math to prove it.
You can't compare Monday vs. Wednesday because you've never tracked revenue by route day.
You're spending too much time on the road between stops but don't know which routes to reorganize.
This spreadsheet fixes all of it. Free.
When spreadsheets stop scaling, PoolDial picks up where they leave off.
Start Free Trial