Enter your pool count and growth rate. Project revenue month by month for a year.
Free spreadsheet to project monthly revenue with seasonal adjustments, customer growth, and churn tracking.

Free. Just enter your email.
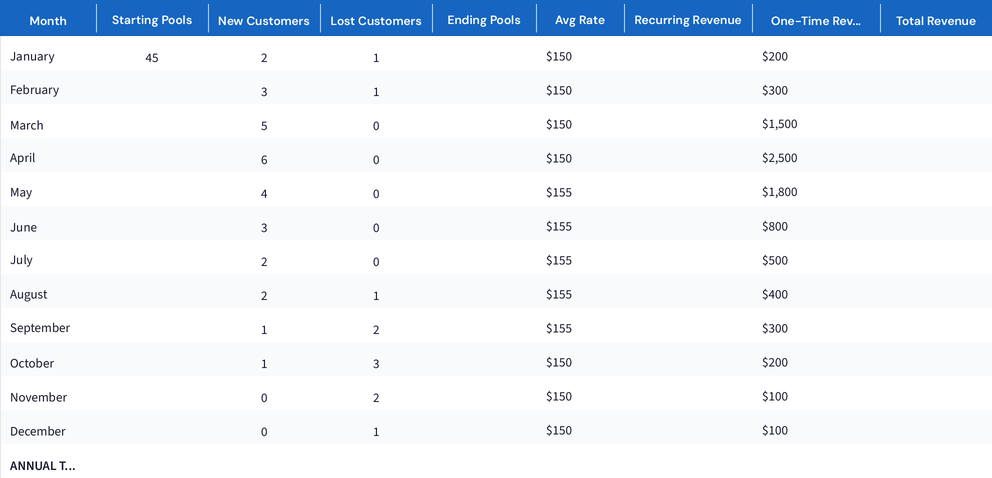
Pool service revenue follows predictable seasonal patterns in most markets. Customer additions peak in spring (March-May), remain steady through summer, and cancellations increase in fall (September-November). Accurate forecasting accounts for these patterns, customer growth rates, churn, and one-time revenue from repairs and seasonal services.
This spreadsheet projects monthly revenue based on starting pool count, new customer additions, customer losses, average monthly rate, and one-time revenue. Each month's ending pool count becomes the next month's starting count, creating a rolling projection that accounts for growth and churn simultaneously.
In markets with seasonal variation, expect one-time revenue (openings, closings, startups) to peak in March-April and September-October. Recurring revenue peaks when pool count is highest (typically July-August). Monthly revenue can vary 30-50% between peak and off-peak months, making cash reserves essential for covering fixed costs during slow periods.
Revenue forecasts inform hiring timelines (hire before the spring rush), equipment purchases (buy in winter when prices are lower), marketing spend allocation (increase in January-February to capture spring signups), and cash reserve planning (save summer surplus for winter expenses).
When spreadsheets stop scaling, PoolDial picks up where they leave off.
Start Free Trial